The Internet and the latest Information and Communication Technologies revolutionized the way in which users interact with the GI resources, providing the foundation for developing what is known today as Online GIS or Web GIS. This new GIS paradigm exposes GI content and tools over the web, contributing to the GIS democratization. In this context, Spatial Data Infrastructures (SDI) with its frameworks and guidelines provide the foundation for improving the discovery and usage of geographic resources within and shared by and the different public and organizations.
The interdisciplinary project ‚SDI: Services Implementation‘ was centred around the setup and and integration of a spatial data infrastructure including the setup of geodatabases, the management of geodata within the database, the publishing of geoservices and the visualization of the data. The goal was to introduce the technical foundation for evolving service-oriented (geographic) information architectures driven by SDIs.
The project was conducted as a groupwork of two students each. The goal we defined within the project was to create a dashboard for the global Covid-19 vaccination campaign showing the daily statistics about infections, vaccinations and other related information. Key tasks were divided into four points:
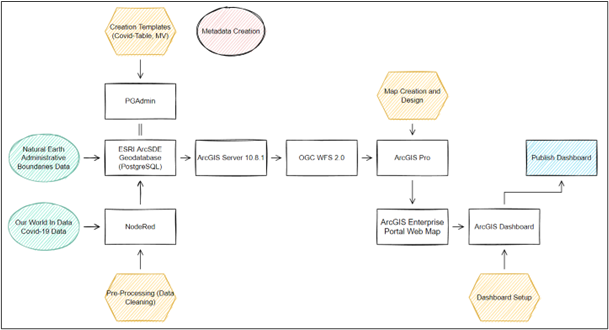
- Identification and development of reproducible workflows for combining and integrating identified geospatial and additional data sources.
- Organization of geospatial information in a ISO compliant manner in geodatabases with ISO compliant metadata descriptions.
- Create and publish standardized services to share out the resources.
- Present and communicate the services in an adequate format.
For sharing the data and tracking the progress of the project, the platform GitLab was used.
Project Concept
The topic on which the project in the end was narrowed down shifted away from the global vaccine campaign efforts towards the integration of information on global socioeconomic attributes at country level. The idea was to illustrate the daily global Corona status in the light of the developing status of a country as this usually relates to the level of healthcare. This adds new dimensions to the understanding of the global status and for the comparison of disparities between countries, regions or continents.
While the source of the Corona data was already secured, socioeconomic data was taken from the data centre of the United Nations development program (UNDP). Combined with a geospatial dataset of global administrative boundaries all relevant data was available to realize the project concept.
Results
The final result of the SDI project and preceding workflows was the dashboard. As the goal of the project was to incorporate and compare Covid-19 data and socioeconomic data, the focus of the dashboard design was set goals. The dashboard incorporates the data sources previously described and presents them in a clear structure. The intention was to make the information easily accessible as the set target audience does not consist exclusively of geospatial experts.

To make better use of the dynamic capabilities of dashboards, different forms of interactivity were integrated. For example, users can click on individual countries in the country list on the left side of the dashboard, then the respective country’s borders will be highlighted and a zoom onto the selected country will take place. If the user wants to get further information about certain countries, a mouse click on a country will open a pop-up window showing more detailed information about current Covid-19 numbers and the socioeconomic status of the selected country. Should the user want to filter the countries based on their average income, they can do so by selecting the income group in the list on the upper right of the dashboard. Per default no filtering is applied, but selecting a filter (e.g. “High income: OECD”) will have an impact on the countries in the county list on the left side of the dashboard, as well as the number of new deaths and new vaccinations displayed at the top of the dashboard. The values are then updated according to the selection made. Information about the dashboard, its authors and the used data references were integrated into a separate window that can be selected next to the map selection. It then replaces the web map in the map frame.